Projects, designs, and writings on health IT

2016-07-14

ResultCast: A Tool For Reporting of Results

4:01 PM Posted by David, MD No comments


Introduction

For real-time reporting of long-term EEG results in our hospital, we have an extensive email listserv, through which brief reports are sent three times daily. Most email recipients have no patients on the list, and therefore users are forced to sort through the junk every day. 
In many cases the recipients of the messages are not the primary providers of the patients, and there are many degrees of separation between the patient, the providers, the interpreters of the data.

EEG machine <-> EEG technician <-> EEG fellow <-> Neurology consult team <-> Primary team <-> Patient

Such a system has limitations


  • Workflow burden - EEG interpreters have many hours of data to manually sift through to find important data
  • Delayed diagnosis (detection), and communication of conditions like subclinical status epilepticus 
  • Delayed feedback of adequacy of anticonvulsant therapy – there are many patients connected at a given time, routinely reported three times daily
  • Fragmented communication - Primary provider is often excluded from the primary conversation (when not a part of the listserv)
  • EEG interpreter is excluded from the clinical updates and the clinical context that helps with interpretation of data (medications given, changes in exam)
  • Email inbox clutter
  • Limited continuity – overnight usually by different MD and different EEG fellow (see next page)

Solution

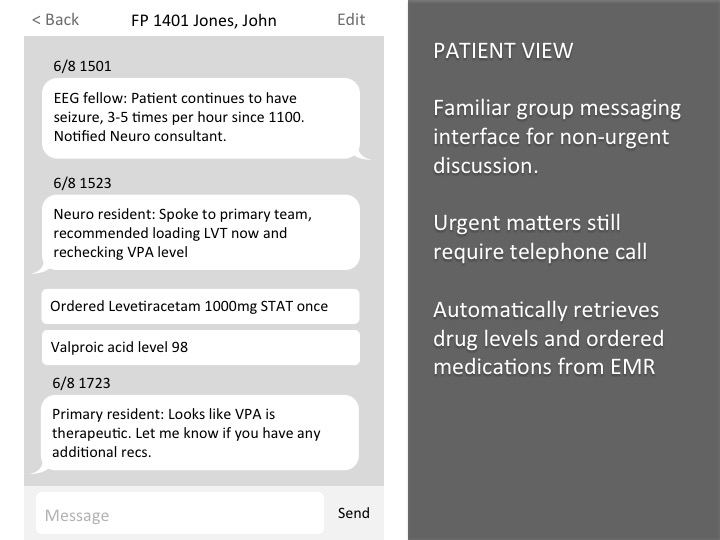
I designed an EMR-integrated system for reporting and broadcasting the data. This system facilitates workflow of the EEG fellow and helps communicate to all relevant providers without cluttering inboxes.


Benefits

  • Earlier diagnosis
    • More clear triage of patients who need close EEG attention overnight
    • Offering Primary provider involvement in the conversation encourages them to contribute updated clinical status, to seek help at critical times, and to know what to look out for.
  • Reduced resource utilization
    • More clear indications that goals have been met and sooner discontinuation of EEG. Often a patient is connected to continuous EEG because of a poor mental status, and could be immediately disconnected once they show wakefulness. The primary team may be aware of wakefulness, but leaves the EEG on.
  • Streamlined communication
    • This system reduces cluttered email chains and allows EEG readers to leave more frequent updates on patients who need them without feeling like they are cluttering in boxes.
    • Handoffs – overnight person sees the conversation that occurred earlier in the day and vice versa


2016-04-12

Fingerstick glucose

2:40 PM Posted by David, MD No comments
This is the start of a series where I will generate charts of de-identified data analysis, revealing some things we knew and some we did not about physiology. The queries that I run do not return any protected health information.

Fingerstick glucose

Fingerstick glucose can be measured with a handheld device with instantaneous results. They are regarded as less accurate than the gold standard laboratory glucose. Here I plotted fingerstick glucose measurements against laboratory glucose measurements that were done within 15 minutes of each other. Except for a few outliers, the reliability appears good.


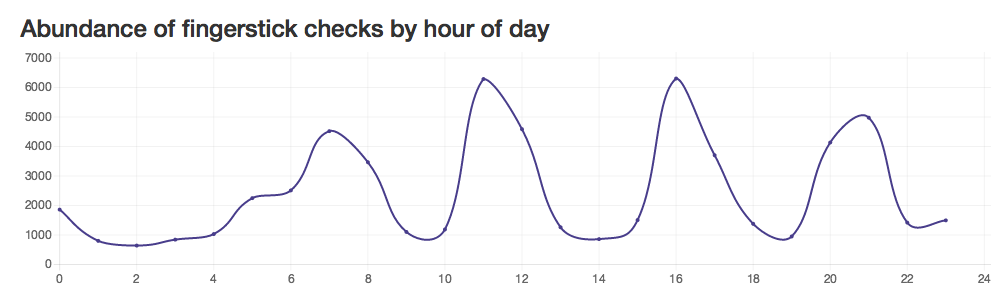
The abundance of fingerstick measurements by hour of day reveals, as expected, peaks, at 7am, 11am, 4pm, and 9pm, before breakfast, lunch, dinner, and bedtime.


The average glucose measurement by hour of day reveals a diurnal trend that is influenced by the meals we eat.

Hypoglycemic events (glucose measurement under 60) are most common at 3am, 9am, 2pm, 6pm, and 10pm. This corresponds to 1-2 hours after meals. Is this perhaps from people eating less than expected?

Hyperglycemic events (glucose measurement over 300) tend to happen at the same post-meal times.

When I stratify the population by age, we can see that people over 40 tend to remain at a higher glucose level, even between meals. Over time, their area under the curve is significantly higher. I chose not to adjust for other factors like comorbid illness and weight, because in real life those things co-occur. Therefore, this does not evaluate age as an independent risk factor.

When I stratify the population by weight, we can see that there is minimal difference between patients over and under 80kg. The only significant difference is overnight at 2-4am, when the heavier group has a much higher level.
The trend continues when we stratify with a cutoff of 120kg.

2016-04-06

Handbook Publisher

9:58 PM Posted by David, MD , No comments

Introduction

Medical providers often use quick-reference handbooks that are specific to their hospital or specialty. Handbook Publisher is an open source app that offers wiki-style editing and sharing of content. It is built with a front end framework for a lag-free experience.

I built this to publish content written along with several colleges about acute stroke management. This tool could be useful for institutional branding.

This project is open source
https://github.com/davehdo/handbook-publisher

Technologies

Rails 4
Angularjs
MongoDB

Screenshots


2016-01-09

Simple problem list

9:06 PM Posted by David, MD , , No comments

Introduction

Tools for physician workflow (e.g. "signout" and "handoff" applications) often neglect the fact that actionable items are tightly associated with plans and problems. Here I designed a Problem List app where problems are identified for billing and other purposes, and items with square brackets are interpreted as checklist items. Using a simple markdown language prevents users from having to update information in two places.

This project is open source: https://github.com/davehdo/simple-problem-list 

Features

  • a simple markdown language with two-way binding produces interactive checklists that automatically convert [] to [x] and vice versa
  • client side framework gives a seamless experience without pauses for loading

Future directions


  • version control and conflict management for multiple users
  • allow users to assign ICD codes to problems using autocomplete

Technologies

  • Backbone.js 
  • Twitter Bootstrap


Below is the user interface for entering the plan in free text. 

After saving, problems are considered separately and actionable items are pulled to the checklist on the side.

After plans are set for the day, actionable items can be seen and checked off from a list view.